Welcome!
Written on May 15th, 2020 by Kat Correia
When we started our semester together as a Data Science (Stat231-01) class in January of 2020, none of us could have imagined the way in which the semester would abruptly change less than two months later.
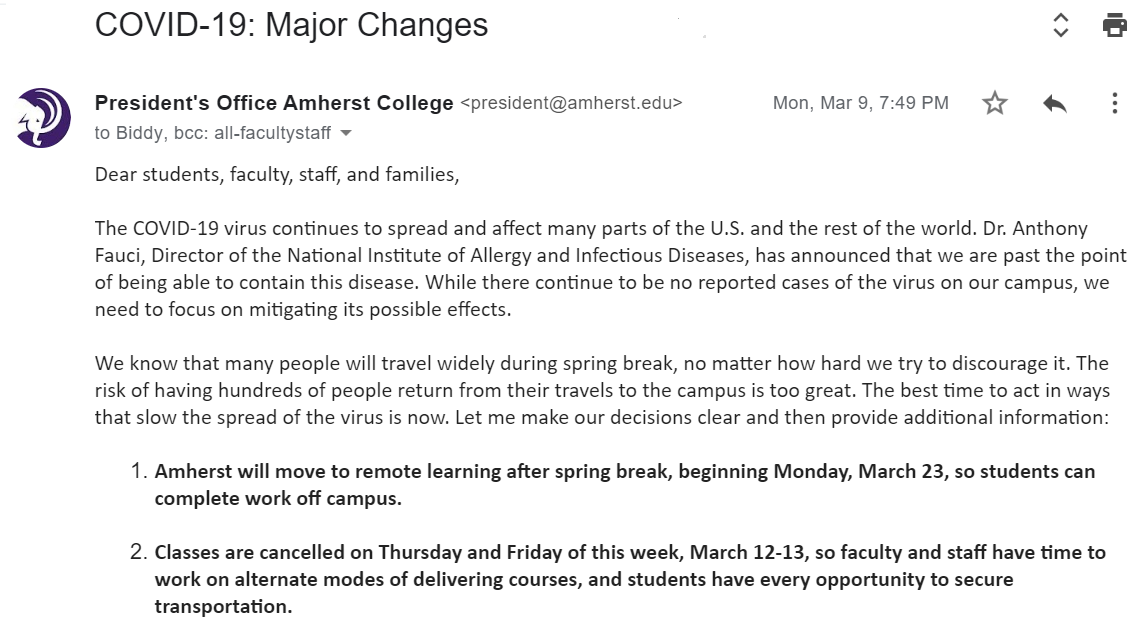
As we quickly moved to a remote learning structure, original plans for projects, topics covered, and activities for the class were foiled. One challenge of remote learning that many students voiced was the difficulty of structuring our time in the absence of the usual structures in place when on campus. Indeed, I struggled myself with time management – as someone who normally blocks her entire workday in a calendar, the uncertainty of how to fit in work on any given day with my two young children at home made it hard to stick to any schedule.
When I came across this article by Albert Kim and Johanna Hardin, I thought their Google Calendar activity would be particularly useful to my students (and myself) during this time.
How are we spending our time these days? Like the activity introduced in the article, we tracked how we were spending our time using Google Calendar. We imported the calendar data into R, and analyzed it to provide insights into various questions about how our time was spent during the end of a semester in the middle of a pandemic.
Despite what sometimes felt like insurmountable challenges, days filled with uncertainty, anxiety, and grief, the students diligently documented their time, explored new types of visualizations, and submitted fun reports. I thank them for their patience with me this semester, their efforts throughout the semester, and their sustained curiousity, creativity, and grit admidst a changing world.